


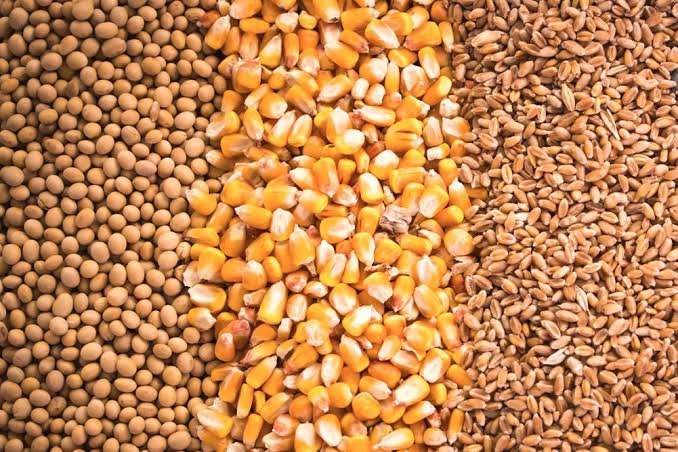
Global trade in corn (maize) and soybean meal remains central to the economics of poultry, swine, dairy, beef and aquaculture production. Corn provides a major source of dietary energy, while soybean meal is one of the principal globally traded protein ingredients used in compound feed.
As of October 2026, trade patterns reflect changing South American supply conditions, competition among export origins, growing protein-feed requirements in parts of Asia, and shifts in procurement and logistics. Argentina has strengthened its position in selected North African corn markets, while Indonesia and the Philippines remain important destinations to monitor for soybean meal.
The latest US Department of Agriculture (USDA) market outlooks provide the foundation for assessing global production, consumption, exports, imports and stocks. However, calendar-year customs data, marketing-year forecasts and reported commercial commitments measure different things and must be presented separately.
For feed manufacturers, traders and procurement teams, the key question is not simply which country exports the most grain or meal. It is which origin can reliably deliver the required nutritional specification at a competitive landed cost, with acceptable quality, regulatory compliance and supply-chain risk.
Key findings
-
Corn: Argentina’s 2025/26 harvest and increased shipments to North Africa have altered competition among suppliers. Brazil’s growing domestic corn consumption, including demand from ethanol production, is an important variable in its export availability.
-
Soybean meal: South America and the United States are major supply centres. Asian feed markets, particularly Indonesia and the Philippines, warrant close monitoring.
-
Trade measurement: October 2026 is incomplete. A global October customs total cannot yet be treated as final.
-
Feed-industry implications: Purchasing decisions should account for freight, currency, duties, quality, protein or energy value, and the reliability of delivery—not just benchmark commodity prices.
-
2026–27 outlook: Weather, crop revisions, domestic processing, livestock-sector demand and trade policy will influence the balance between export availability and feed-import requirements.
Driven by record North American corn yields ($181.2\text{ bu/acre}$) and expanding South American crush capacity, global raw feed supply has reached a heavy surplus in Q4 2026. This dynamic has lowered global baseline feed costs, providing cash margin relief to livestock and poultry integrators across East Asia, Southeast Asia, and the Middle East.
How the global animal-feed commodity trade works
Corn and soybean meal are related through their role in feed formulation, but their supply chains differ.
Corn is traded primarily as an energy ingredient. Its export availability depends on harvest size, domestic feed consumption, industrial use, ethanol production, stocks and shipping economics.
Soybean meal is a protein ingredient produced when soybeans are crushed to obtain meal and oil. Countries with substantial soybean-crushing capacity can be major meal exporters even when they are not the world’s largest soybean producers. Conversely, countries with large livestock and feed industries but limited domestic crushing capacity often import meal directly.
The USDA’s Production, Supply and Distribution (PSD) database provides country-level agricultural balances, while USDA Foreign Agricultural Service trade data and UN Comtrade help track actual commodity flows.
Corn versus soybean meal: trade characteristics
Indicator |
Corn/maize |
Soybean meal |
|---|---|---|
Principal feed function |
Energy, mainly from starch |
Protein and essential amino acids |
Main export centres |
United States, Brazil, Argentina and Ukraine, subject to market conditions |
Argentina, Brazil and the United States |
Major demand centres to monitor |
Mexico, Japan, South Korea, Vietnam, Egypt and other feed-importing markets |
Indonesia, the Philippines, Vietnam, Mexico and the European Union |
Key supply drivers |
Crop size, domestic consumption, ethanol demand, stocks and freight |
Soybean availability, crushing margins, oil demand and meal-processing capacity |
Important substitutes |
Feed wheat, sorghum and other energy ingredients |
Rapeseed meal, sunflower meal and other protein meals |
Critical procurement risks |
Weather, mycotoxins, port disruption and export restrictions |
Quality variation, crushing disruption, freight, policy and soybean-price volatility |
2026 – Global Trade in Corn and Soymeal
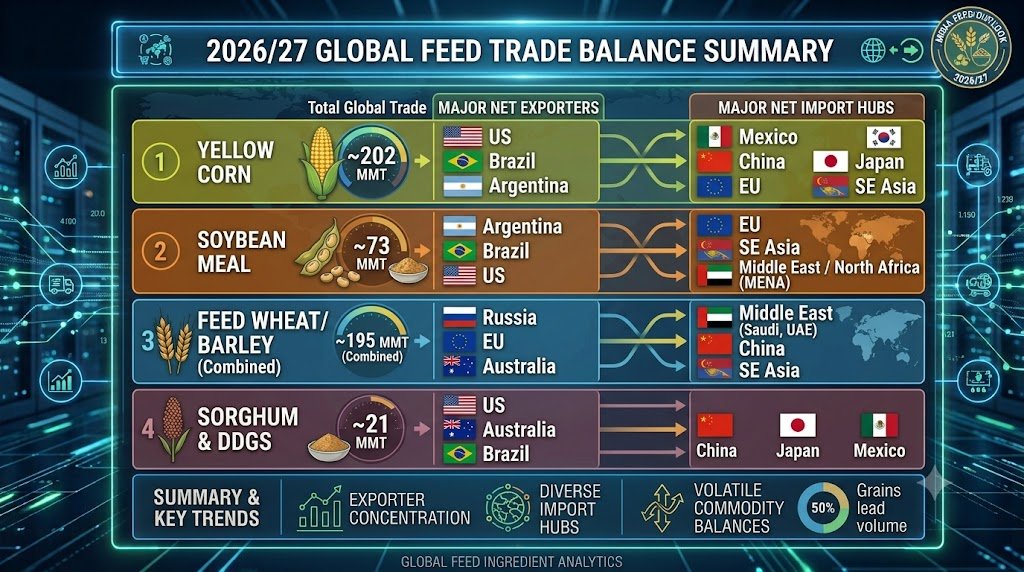
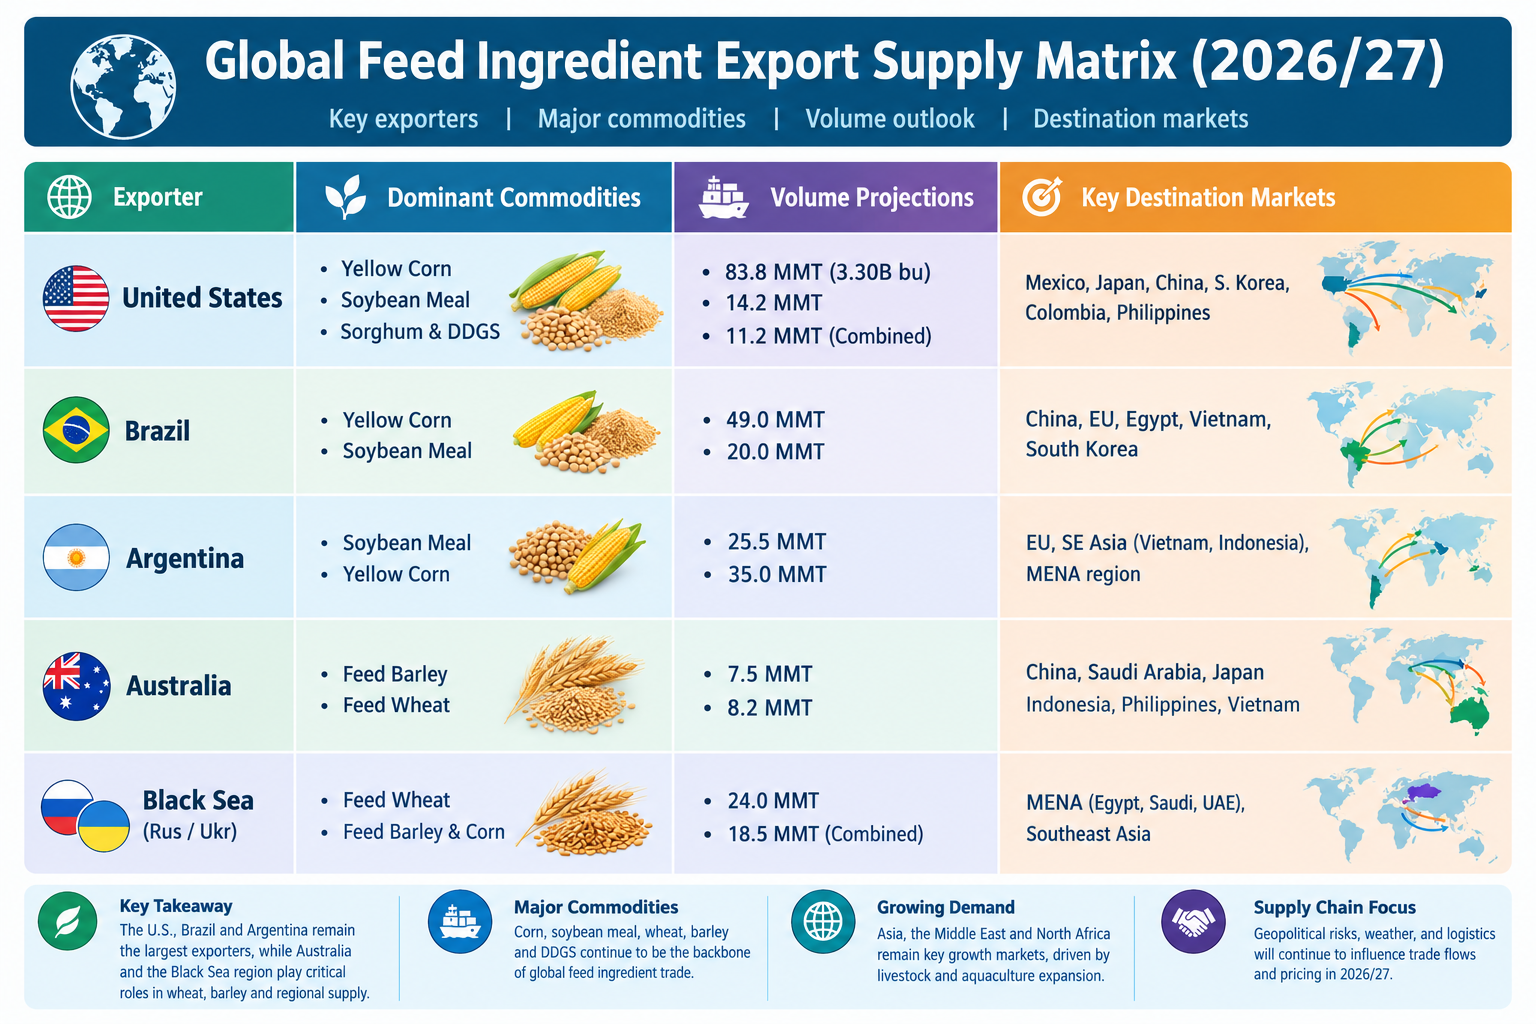
The United States, Brazil and Argentina are among the principal corn exporters. Ukraine remains an important supplier, although war-related logistics and port access can affect its ability to ship consistently. Paraguay and South Africa also matter in regional trade.
Major corn-exporting countries
Exporting country |
Competitive strengths |
Factors to monitor in 2026 |
|---|---|---|
United States |
Large production base, established export infrastructure and broad buyer access |
Crop revisions, domestic feed and ethanol demand, export sales and competing-origin prices |
Brazil |
Large agricultural base and established export logistics |
Domestic feed consumption, corn ethanol, second-crop production and freight |
Argentina |
Major export capacity and competitive South American supply |
Harvest size, export pace, currency, policy and port conditions |
Ukraine |
Established Black Sea grain supplier |
Security, port operations, shipping costs and access to export routes |
Paraguay |
Regional production and established South American trade links |
Crop size, river logistics and regional demand |
South Africa |
Important supplier within southern Africa |
Domestic harvest, regional demand and exportable surplus |
For current production and trade estimates, analysts should consult the latest USDA PSD data. Rankings should be extracted using the same marketing year for every country rather than combining estimates from different periods.
1. East & Southeast Asia: Major Import Profiles
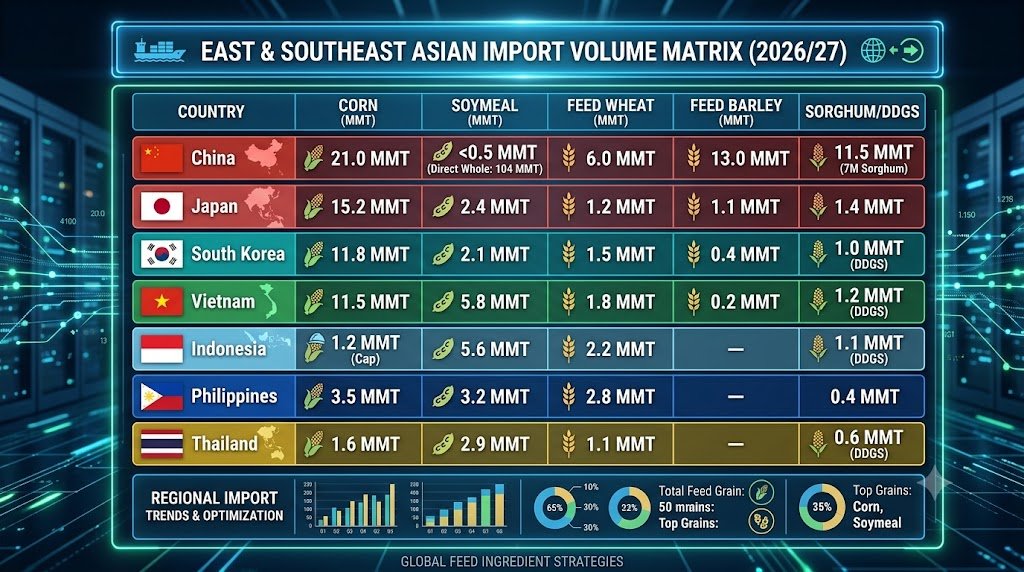
East and Southeast Asia remain the world’s primary growth centers for protein consumption, requiring massive imports of energy grains (corn, feed wheat, barley) and high-protein meals (soybean meal, DDGS).
Country-Level Analysis:
China
-
Corn & Substitutes: Driven by swine herd stabilization, China’s corn import total is projected at 21.0 MMT, supplied primarily by Brazil (~65–70%) and the United States (~20%). To offset domestic corn prices, China is importing 13.0 MMT of feed/malting barley (dominated by Australian origin following tariff rollbacks) and 7.0 MMT of grain sorghum (U.S., Australian, and Brazilian origin).
-
Soybean Strategy: China does not import direct soybean meal; it processes 103–104 MMT of whole raw soybeans internally to generate over 85 MMT of domestic soybean meal, serving as the world’s largest oilseed processor.
Vietnam
-
Swine & Aquaculture Demand: Vietnam is Southeast Asia’s largest importer of protein meals. It relies on South American (Argentina/Brazil) origin for 5.8 MMT of soybean meal.
-
Coarse Grains: Imports 11.5 MMT of yellow corn and 1.8 MMT of feed wheat, sourcing heavily from South America, Ukraine, and Australia.
Indonesia
-
Import Protectionism vs. Poultry Demand: Indonesia limits direct corn imports (1.2 MMT) via state-issued import permits (Bulog) to protect domestic corn farmers.
-
Protein Reliance: To feed its expanding poultry integrator sector, Indonesia imports 5.6 MMT of soybean meal (primarily from Argentina) and 2.2 MMT of feed-grade wheat from Australia and the Black Sea.
Philippines
-
African Swine Fever (ASF) Recovery: As hog repopulation advances alongside expanding broiler production, the Philippines is importing 3.5 MMT of corn and 2.8 MMT of feed wheat.
-
Soybean Meal: Imports 3.2 MMT of soybean meal, with U.S. origin taking a leading market share due to trade preference agreements and quality preferences for poultry rations.
Japan & South Korea
-
Feed Mills & Compound Rations: Highly mature, stable feed industries. Combined, they import 27.0 MMT of corn (Japan: 15.2 MMT; South Korea: 11.8 MMT), sourcing primarily from the U.S. Gulf, Pacific Northwest (PNW), and Brazil. They also import a combined 2.4 MMT of U.S. Distillers Dried Grains with Solubles (DDGS) for dairy and beef cattle feed rations.
2. Middle East & North Africa (MENA): Major Import Profiles
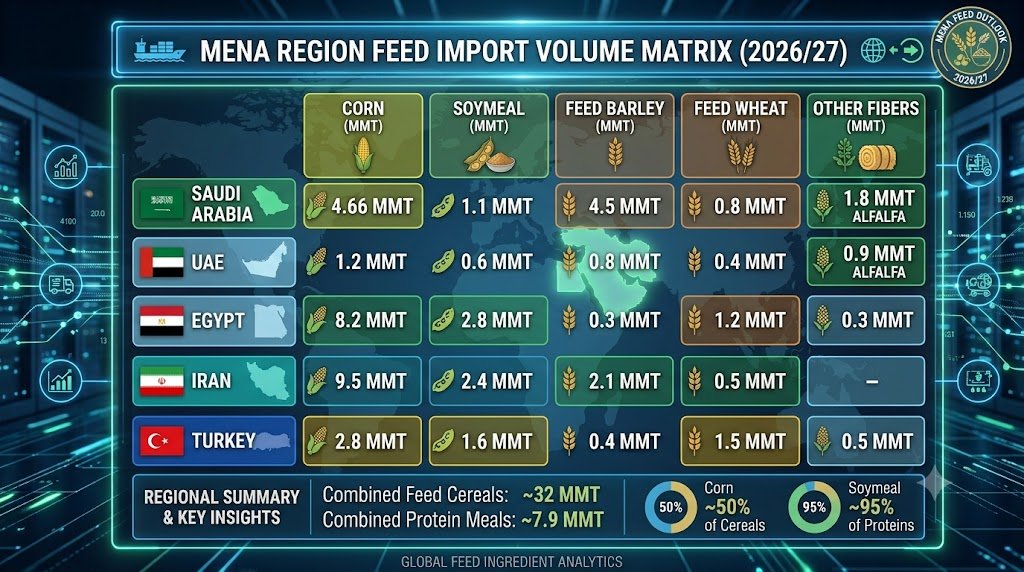
The MENA region represents a major global deficit zone for animal feed, driven by arid climates, scarce water resources for forage production, and expanding commercial poultry, sheep, goat, and camel populations.
Country-Level Analysis:
Saudi Arabia
-
Barley-to-Processed Feed Transition: Saudi Arabia is the world’s second-largest importer of feed barley (4.5 MMT), which is distributed primarily as whole-grain feed for camel, sheep, and goat herds.
-
Industrial Feed Expansion: Driven by government initiatives to phase out water-intensive domestic forage crops, the Saudi General Food Security Authority (GFSA) and private processors (e.g., ARASCO) are expanding commercial pelleted feed mills. Consequently, yellow corn imports are rising to 4.66 MMT, paired with 1.1 MMT of imported soybean meal and 1.8 MMT of imported U.S./Spanish alfalfa hay.
Egypt
-
Poultry Sector Feed Crisis Relief: Following multi-year currency devaluations, Egyptian feed grain liquidity has normalized. Egypt is importing 8.2 MMT of corn (sourced via short-haul routes from Romania, Bulgaria, Ukraine, and Argentina) and 2.8 MMT of soybean meal to supply its poultry sector.
Iran
-
State Trading Operations: Iranian state purchasing agencies (SLAL) continue to procure large volumes of feed ingredients via Black Sea and South American channels, importing 9.5 MMT of corn, 2.4 MMT of soybean meal, and 2.1 MMT of feed barley.
3. Major Export Supply Origin Profiles
Indonesia: a large soybean-meal demand centre
Indonesia imported 5.96 million tonnes of soybean meal in 2025, according to reporting reviewed for this analysis. Reuters also reported a 2026 government assignment involving state-owned Berdikari and an import requirement of around 5 million tonnes.
The distinction is important: an import assignment or target is not the same as completed customs imports. Procurement teams should track the assigned volume, tenders, contracts, shipments and final delivered tonnage separately.
Philippines: a rising import forecast
USDA-reported figures put Philippine soybean-meal imports at an estimated 3.5 million tonnes in 2026, with a forecast of 3.85 million tonnes for 2027.
This projected increase makes the Philippines an important market to watch for protein-meal exporters. Actual demand will depend on poultry production, livestock-sector conditions, relative feed prices and competition among suppliers.
For exporters, the commercial opportunity is not established by the forecast alone: it must be validated through import data, customer requirements, procurement cycles and confirmed shipments.
China: soybean imports are not soybean-meal imports
China plays a central role in global soybean trade because it imports large quantities of soybeans and crushes them domestically to produce soybean meal and soybean oil.
This distinction matters when analysing animal-feed trade. China’s soybean imports are an upstream indicator for domestic meal production, but they cannot be added to or substituted for soybean-meal import figures.
In late September and October 2026, Reuters reporting described weak feed demand, crushing-margin pressures and high soybean inventories as relevant factors in Chinese buying. Subsequent reports described new Chinese state-linked purchases of US soybeans for future delivery.
These developments may affect soybean availability and crushing economics. They do not, by themselves, demonstrate an equivalent increase in Chinese soybean-meal imports.
4. Analytical Takeaways for Animal Nutritionists & Feed Procurement Teams
-
Substitutability Optimization: With Australian feed barley and Black Sea feed wheat trading at narrower spreads against FOB corn, Asian feed mills (particularly in Vietnam and the Philippines) are adjusting baseline formulations to incorporate up to 15–20% feed wheat/barley in swine and poultry rations.
-
Protein Cost Deflation: Argentina’s crush recovery (processing a 49.3 MMT soybean crop) alongside elevated U.S. domestic crush margins has lowered global soybean meal futures toward $340/ton. This creates favorable hedging opportunities for commercial livestock producers across East Asia and the Middle East.
-
Freight & Origin Arbitrage: Exporters across the U.S. Pacific Northwest (PNW) hold a structural freight advantage for shipments to Japan and South Korea, while Brazilian origin retains a dominant market share for long-haul shipments to mainland China.
5. Global corn and soybean-meal trade outlook for 2026–27
Three scenarios are relevant to exporters, importers and feed manufacturers.
Scenario 1: South American corn remains competitive
If Argentina retains its increased North African market share and Brazil continues to absorb more corn domestically, importers may need to reassess supplier mixes and shipping schedules. Actual outcomes will depend on crop revisions, export pace, freight and relative prices.
Scenario 2: Asian soybean-meal demand expands
The Philippines’ forecast increase in meal imports and Indonesia’s substantial import requirement provide demand signals worth monitoring. Stronger feed demand could support import volumes, but the outcome will depend on livestock production, local feed economics and competition among suppliers.
Scenario 3: Policy changes redirect trade
Import assignments, export restrictions, tariffs, currency controls and geopolitical disruptions can redirect trade flows. Businesses should distinguish government procurement targets and reported sales from contracts executed and cargoes delivered.
These are scenarios, not unconditional price or volume predictions. Monthly updates should revise them as official data and confirmed shipment information become available.
Conclusion: implications for feed companies, traders and investors
Global corn and soybean-meal trade remains fundamental to the economics of animal protein. The current evidence highlights Argentina’s stronger corn presence in selected North African markets, South America’s central role in soybean-meal exports, and the importance of Asian protein-feed demand.
Four actions are recommended for feed businesses:
-
Monitor origins, not just world prices. Track the competitiveness of the United States, Brazil, Argentina and Ukraine for corn, and Argentina, Brazil and the United States for soybean meal.
-
Track destination-specific demand. Indonesia, the Philippines, Vietnam, Mexico, Egypt, Japan and South Korea warrant attention, with rankings confirmed against comparable customs data.
-
Separate actuals from forecasts. Do not combine customs shipments, USDA marketing-year estimates, export-sales commitments and government procurement targets.
-
Buy on delivered nutritional value. Compare freight, duties, currency, quality and usable energy or digestible protein before selecting a supplier.
Quantitative & Qualitative Tariff Frameworks (Major Feed Corridors)
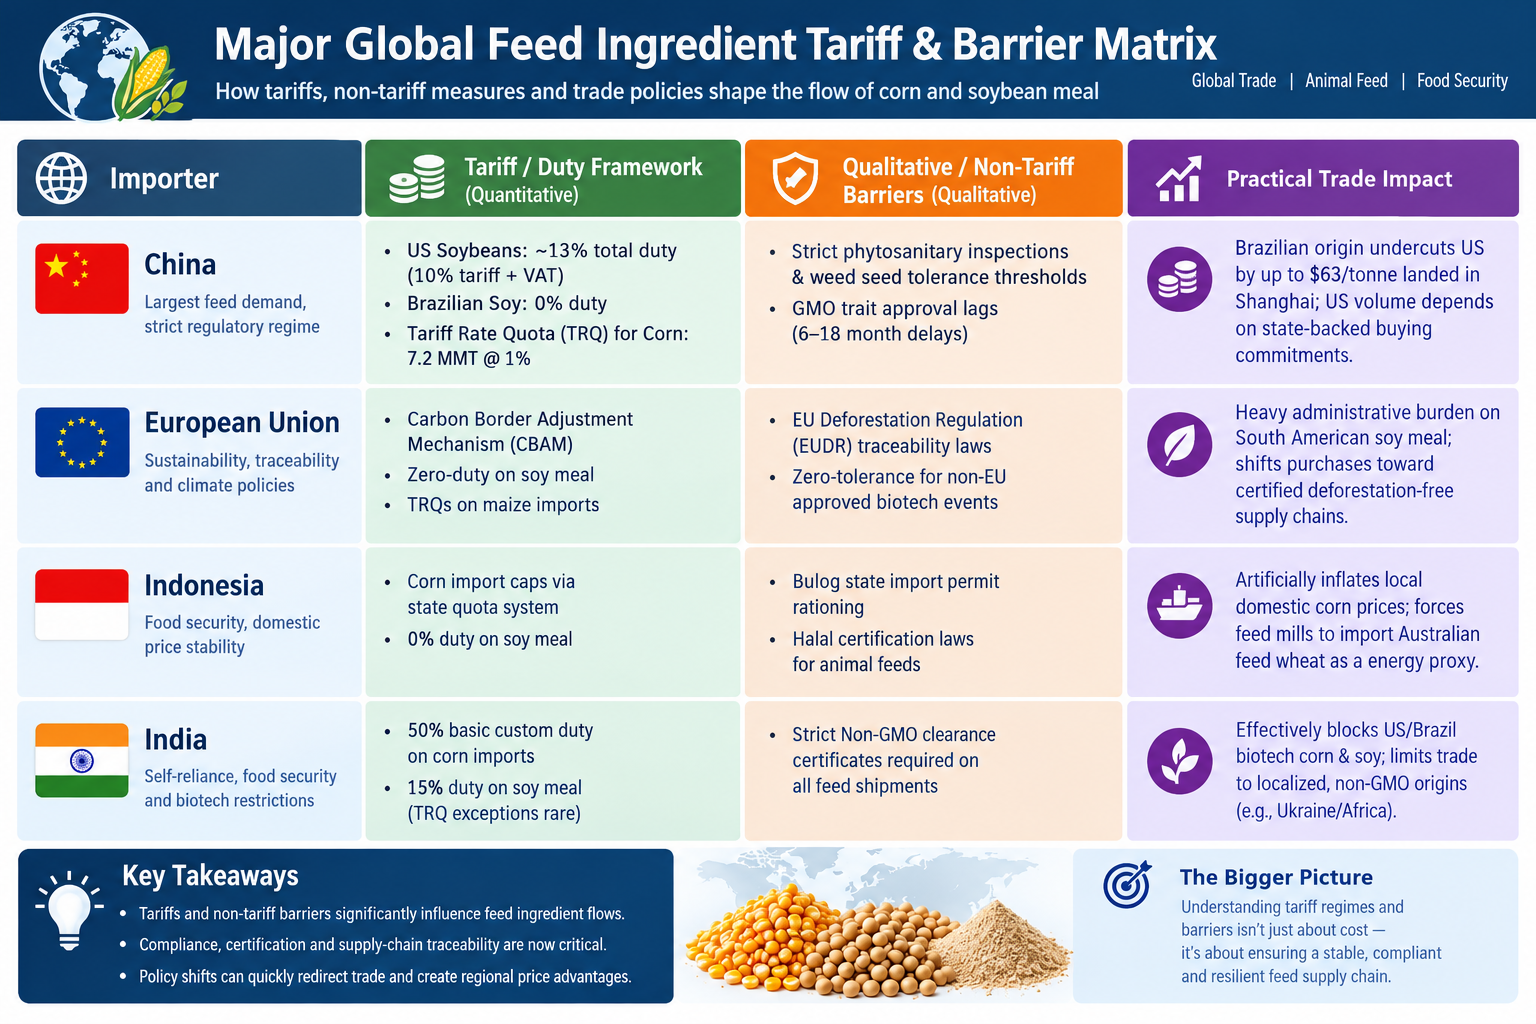
Key Policy Dynamics:
-
China’s Tariff Exclusion Paradox: Commercial Chinese crushers face a 13% combined tariff on U.S. soybean cargoes, making Brazilian origin landed costs up to $63/tonne cheaper into Shanghai. Despite this differential, state-owned Chinese enterprises (e.g., COFCO) periodically purchase U.S. Gulf/PNW cargoes to fulfill state-level trade commitments.
-
EUDR Compliance Bottlenecks: The European Union’s strict Deforestation Regulation (EUDR) mandates polygon-level satellite geolocation data for all imported soy and meal. While providing a market advantage to certified sustainable suppliers, it imposes significant compliance overhead on South American exporters.
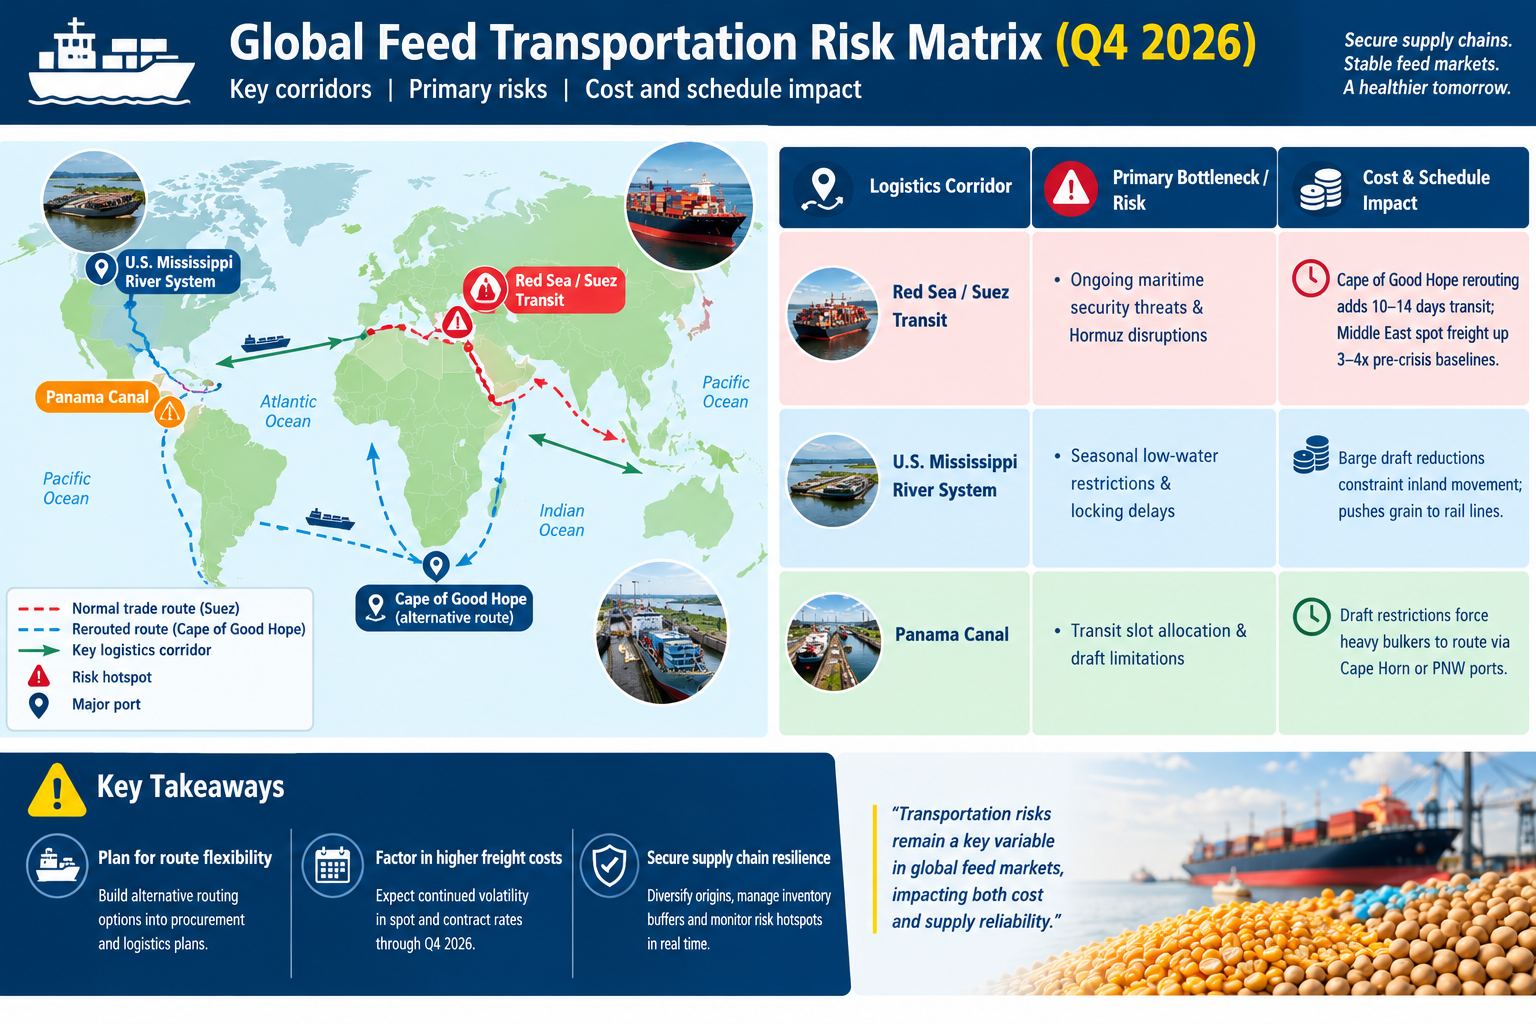
Supply Chain Bottlenecks & Freight Realities
-
Middle East Freight Premium: Maritime security risks across the Red Sea and surrounding chokepoints have forced bulk carriers and container lines to append multiple surcharge layers—including War Risk Surcharges ($500–$1,500/FEU) and Emergency Fuel Surcharges. Transit costs from Asia/South America to Red Sea ports (e.g., Jeddah, Dammam) remain elevated, inflating landed feed costs across Saudi Arabia, Egypt, and the Persian Gulf.
-
U.S. Export Freight Surge: Strong Q3 export loading activity combined with rising marine fuel prices drove U.S. ocean grain freight rates higher, increasing the delivered cost of U.S. Gulf corn into Mediterranean and East Asian destinations.
Forward Guidance & Strategic Recommendations for Procurement Teams
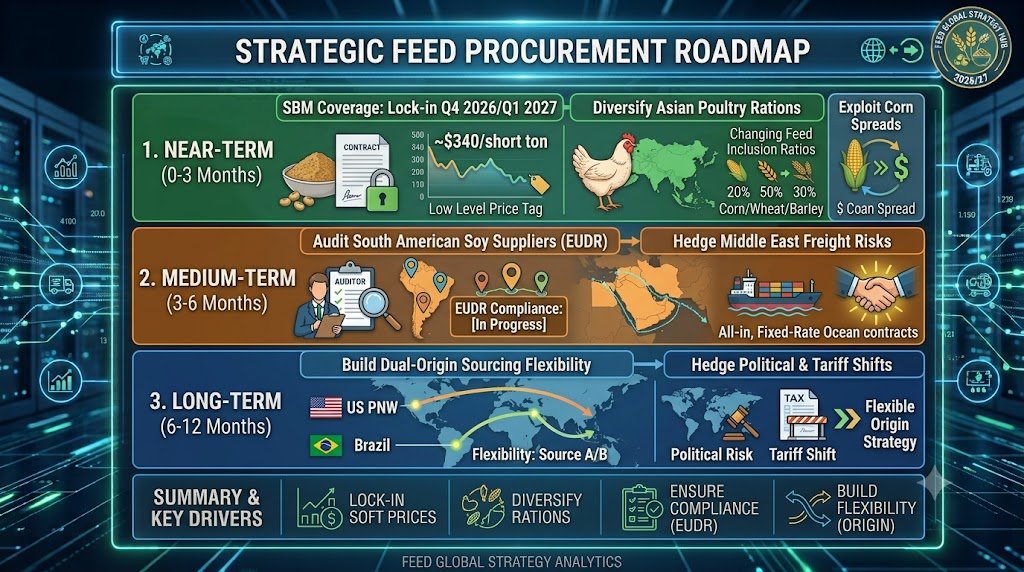
Actionable Takeaways:
-
Capitalize on Cost Deflation: Take advantage of lower CBOT futures and ample Argentine/U.S. crush output by securing forward coverage on high-protein meals through Q1 2027
-
Optimize Formulation Flexibility: Feed nutritionists across Southeast Asia should keep matrix formulations dynamic—utilizing feed-grade wheat, barley, and DDGS whenever regional corn basis spikes due to local freight or tariff friction
-
Logistics Risk Management: Procurement executives delivering into MENA or East Asian markets must insist on all-in freight quotes (inclusive of War Risk and Emergency Fuel surcharges) and build a 7- to 14-day schedule buffer to absorb maritime rerouting delays
Sources and further reading
-
-
USDA Foreign Agricultural Service — Production, Supply and Distribution database. Country-level agricultural supply-demand balances and marketing-year trade estimates. Access PSD Online
-
USDA Foreign Agricultural Service — Trade Data. US agricultural trade and partner-country information. Access USDA Trade Data
-
USDA Global Agricultural Trade System. Detailed US trade statistics. Access GATS
-
USDA Economic Research Service — Corn and Other Feed Grains. Market outlook and supply-demand analysis. Read the outlook
-
USDA Economic Research Service — Soybeans and Oil Crops. Oilseed-market analysis and outlook. Read the outlook
-
UN Comtrade. International merchandise trade by reporting country, partner and commodity. Access UN Comtrade
-
FAOSTAT. Historical agricultural production and trade data. Access FAOSTAT
-

