



Dateline: Global Animal Health Markets | 9 October 2026
Report type: Quarterly earnings preview and sector analysis
Companies: IDEXX Laboratories (NASDAQ: IDXX), Zoetis (NYSE: ZTS), Elanco Animal Health (NYSE: ELAN)
The third-quarter 2026 earnings season will provide an important test of the commercial resilience of the global animal-health industry.
IDEXX Laboratories, Zoetis and Elanco Animal Health are scheduled to report results on 2nd , 5th and 6th of November, respectively. Their disclosures will offer investors an opportunity to assess whether diagnostic testing, companion-animal medicines and recently launched products can sustain growth amid uncertainty around veterinary practice activity and consumer spending.
The three businesses approach this environment from different positions.
-
IDEXX Laboratories enters the quarter with strong recurring diagnostic revenue growth, expanding instrument placements and improving full-year guidance. The key question is whether diagnostic utilisation and the installed-base model can continue to deliver growth even if veterinary visits remain uneven.
-
Zoetis faces a more demanding comparison. Its second-quarter revenue was flat at US$2.5 billion, while organic operational revenue declined 1%. Management lowered its full-year revenue and earnings outlook in August, making the recovery trajectory of its companion-animal portfolio and the performance of its broader business important areas of investor scrutiny.
-
Elanco Animal Health is demonstrating stronger reported momentum. Second-quarter revenue rose 10% to US$1.368 billion, with 8% organic constant-currency growth. Zenrelia and Credelio Quattro were the leading innovation contributors, while management raised its full-year revenue, earnings and innovation targets.
The central investment question is not simply whether the companies will report higher revenue. It is whether that revenue will translate into sustainable earnings, margin expansion and cash generation—and whether growth is being generated by repeatable demand or by launch-related momentum.
Important distinction: The figures in this report are the latest published company results and management guidance available as of 9th of October 2026. Third-quarter results have not yet been reported. Product outlooks and risks discussed below are analytical assessments, not company-confirmed Q3 outcomes.
Earnings calendar and guidance: what investors should know
Company |
Scheduled Q3 results |
Latest full-year 2026 revenue guidance |
Latest adjusted EPS guidance |
Principal investor question |
|---|---|---|---|---|
IDEXX Laboratories |
2 November, before market open |
US$4.700–4.745 billion |
US$14.69–14.94 |
Can recurring diagnostics sustain growth and margin expansion? |
Zoetis |
5 November |
US$9.120–9.320 billion |
US$6.15–6.25 |
Has the business stabilised after a substantial guidance reduction? |
Elanco Animal Health |
6 November, 8:00 a.m. ET |
US$5.090–5.140 billion |
US$1.10–1.16 |
Can new-product growth support margins and continued debt reduction? |
Sources: Company investor-relations announcements and Q2 2026 results. Guidance is management’s latest published outlook, not an independent consensus forecast.
IDEXX confirmed its 2nd of November reporting date on 1st of October. Zoetis announced its 5th of November earnings event on 24th of September, and Elanco confirmed its 6th of November date on 11th of September. IDEXX announcement | Zoetis investor relations | Elanco announcement.
Why the guidance comparison matters
The 3 companies have different revenue bases, product mixes and definitions of adjusted financial performance. Reported growth rates and adjusted EPS should therefore not be compared as if they were directly equivalent measures of operating performance.
Foreign exchange movements, acquisitions, divestitures, pricing, product mix and changes in customer demand can affect reported results. Investors should examine reported revenue alongside each company’s own organic or constant-currency measures, margins, cash flow and guidance.
The most consequential differences are already visible in the second-quarter disclosures: IDEXX reported double-digit recurring diagnostic growth, Zoetis reported flat revenue and reduced its outlook, while Elanco reported broad-based growth led by recently launched products.
Market backdrop: veterinary spending remains important, but the evidence is mixed
Veterinary healthcare is not a single, uniform consumer market. Demand varies by household income, geography, species, disease burden, clinical need and the type of treatment being considered.
Pet owners may defer some preventive visits, dental procedures or elective interventions when budgets are tight, while continuing to purchase essential medicines or seeking care for acute conditions. Conversely, higher diagnostic utilisation or more intensive treatment per consultation can support industry revenue even when visit growth is modest.
The supplied claim that 69% of veterinary practices identify consumer financial pressure as their primary concern, and that unmanaged appointment schedules experience no-show rates as high as 12%, should not be presented as established sector-wide statistics without a clearly identifiable survey, publication date, sample size and methodology. Neither figure is necessary to establish the commercial risk.
There is, however, direct company-level evidence that clinical activity is a relevant variable. IDEXX identifies trends in US clinical visits among the factors that can affect its business. Its second-quarter results also show that diagnostic revenue can grow through higher testing utilisation, product innovation, net customer additions and installed-base expansion. IDEXX Q2 2026 results.
The three demand channels investors should distinguish
1. Visit-driven demand – More consultations can create opportunities for diagnostic tests, vaccinations, parasite prevention and treatment. However, revenue per visit and the mix of services matter as much as visit counts.
2. Recurring or repeat demand – Consumables, prescription refills and ongoing disease management may generate repeat purchases, although they are not completely insulated from changes in clinic traffic or pet-owner budgets.
3. Innovation-driven demand – New products can increase treatment adoption, win share from existing therapies and expand the market. This can support growth even when the broader market is relatively subdued, but launch growth may moderate as the product matures.
These distinctions are particularly important when comparing IDEXX’s diagnostic platform with Zoetis’s established therapeutic franchises and Elanco’s newer companion-animal launches.
Zoetis: a recovery test after the August guidance reduction
Zoetis remains the largest of the three companies by annual revenue. Its latest results, however, make the Q3 release especially important for assessing the direction of the business.
Q2 financial performance
Zoetis metric |
Q2 2026 |
Year-on-year performance |
|---|---|---|
Revenue |
Approximately US$2.5 billion |
Flat on a reported basis |
Organic operational revenue growth |
— |
−1% |
Net income |
US$691 million |
−5% |
Adjusted net income |
US$781 million |
— |
Adjusted diluted EPS |
US$1.87 |
— |
Source: Zoetis, Q2 2026 results, 6 August 2026. Official results.
Zoetis’s August guidance revision was significant. Its previous revenue outlook of US$9.68–9.96 billion was replaced by US$9.12–9.32 billion. The company also revised adjusted diluted EPS guidance from US$6.85–7.00 to US$6.15–6.25.
At the midpoint, the revised revenue range is approximately US$600 million below the previous midpoint, while the adjusted EPS midpoint is US$0.725 lower. The size of the revision means investors will want to understand whether Q2 weakness represents a temporary disruption, a change in demand or a more persistent challenge to the growth trajectory.
The current full-year guidance implies organic operational revenue growth of −3% to −1% and organic operational adjusted net-income growth of −9% to −5%. These measures exclude specified impacts and should not be confused with reported growth.

Companion-animal franchises: dermatology and parasiticides
Zoetis’s companion-animal portfolio remains an important area to monitor.
Apoquel and Cytopoint address canine allergic and inflammatory skin conditions through different therapeutic approaches. Their performance provides insight into the durability of established dermatology franchises, repeat treatment demand and the degree of competitive pressure in a commercially important category.
Simparica Trio is a broad-spectrum parasiticide product covering multiple parasite risks. Its commercial performance can be influenced by seasonality, clinic dispensing, retail and online availability, competitive products, pricing and changes in the number of pets receiving preventive care.
The Q3 question is whether these established franchises are retaining their contribution while newer products compete for veterinarian attention and shelf space.
Librela and Solensia: growth versus adoption maturity Librela for dogs and Solensia for cats are monoclonal-antibody treatments for osteoarthritis pain. These products represent a differentiated therapeutic approach and address chronic conditions that can require ongoing veterinary management.
For investors, the relevant indicators are not just initial adoption. They include the number of clinics using the products, treatment persistence, patient identification, repeat dosing, geographic penetration and any changes in prescribing behaviour.
As a product matures, percentage growth can moderate even when absolute sales continue to increase. Conversely, strong initial uptake does not by itself prove long-term treatment persistence or profitability.

Zoetis: Q3 indicators to watch
-
Revenue and organic operational growth relative to the revised full-year outlook.
-
Companion-animal performance, especially dermatology, parasiticides and osteoarthritis pain management.
-
Changes in adjusted gross margin and operating expenses.
-
Geographic and species-level growth, including livestock businesses.
-
Management’s commentary on clinical visits, pricing, foreign exchange and customer demand.
-
Whether the company maintains, narrows or changes its full-year guidance.
Analyst assessment: Zoetis’s Q3 results need to demonstrate stabilisation more than acceleration. A quarter of improved revenue quality or better operational trends could help rebuild confidence, but the lower full-year outlook makes guidance and management’s explanation of the business trajectory at least as important as the headline EPS figure.
Elanco: innovation momentum, margin expansion and balance-sheet execution
Elanco’s Q2 performance contrasts with Zoetis’s. The company reported growth across companion-animal and farm-animal businesses, while raising its full-year guidance and innovation revenue target.
Q2 financial performance
Elanco metric |
Q2 2026 |
Year-on-year change |
|---|---|---|
Total revenue |
US$1.368 billion |
+10% |
Organic constant-currency revenue growth |
— |
+8% |
Pet Health revenue |
US$718 million |
+12% |
Farm Animal revenue |
US$633 million |
+9% |
Adjusted EBITDA |
US$288 million |
+21% |
Adjusted EBITDA margin |
21.2% |
Higher than prior year |
Adjusted EPS |
US$0.34 |
+31% |
Net leverage ratio |
3.1x adjusted EBITDA |
Lower than year-end 2025 |
Source: Elanco Q2 2026 earnings release. Official results. Figures may not sum due to rounding and the presentation of contract manufacturing and other revenue.
The results show that growth is not confined to pet medicines. Elanco’s US Pet Health and US Farm Animal businesses each recorded 11% organic constant-currency growth in Q2. Its global ruminant business was a particularly strong contributor.
Management raised its 2026 revenue outlook to US$5.09–5.14 billion, adjusted EBITDA to US$1.01–1.035 billion and adjusted EPS to US$1.10–1.16. The company also increased its innovation revenue target to US$1.25 billion.
Elanco’s Q3 guidance, provided in August, is:
Q3 2026 metric |
Management guidance |
|---|---|
Revenue |
US$1.195–1.220 billion |
Adjusted EBITDA |
US$200–215 million |
Adjusted EPS |
US$0.19–0.22 |
The company expected 5%–7% revenue growth excluding specified foreign-exchange, acquisition and royalty effects. These are management expectations, not actual Q3 results.

Zenrelia: the canine dermatology challenger
Zenrelia is one of Elanco’s central companion-animal growth drivers. It is an oral Janus kinase (JAK) inhibitor used for the control of pruritus associated with allergic dermatitis and atopic dermatitis in dogs, subject to local product labels.
Elanco’s Q2 disclosure stated that Zenrelia had achieved blockbuster status on a trailing-four-quarter basis by July year-to-date and was being used in approximately 18,000 US clinics. The company also reported a nine-percentage-point year-on-year increase in US JAK-market share, based on its cited market data. In selected European markets, it reported JAK-market share exceeding 40%.
These figures indicate meaningful commercial penetration, but they are company-reported measures and should be interpreted accordingly. They do not establish the size of the entire canine dermatology market or imply that Zenrelia is directly interchangeable with every competing therapy.
For Q3, investors should look for evidence of continued clinic adoption, repeat prescribing, international expansion and whether launch growth is broad-based rather than concentrated in initial stocking or early adopters.
Competitive comparisons with Zoetis’s Apoquel and Cytopoint need to account for differences in mechanism of action, label, route of administration, clinical profile, safety information and prescribing considerations. It is more accurate to describe Zenrelia as a competitor in canine dermatology than to treat the products as clinically identical.

Credelio Quattro: broad-spectrum parasite protection
Credelio Quattro is another major innovation driver. It provides broad-spectrum parasite protection in a chewable product, including coverage against fleas, ticks, heartworm and tapeworms, according to the applicable product label.
Elanco reported that Credelio Quattro accelerated its share gains in US veterinary clinics during Q2. The company said the product had reached more than 50% of the US clinic base, with approximately 3,000 additional clinics added during the quarter compared with Q1. It also reported launches in Australia, Canada and Japan.
The key commercial question is whether increased distribution translates into sustained sales and repeat purchases. Clinic penetration is an important leading indicator, but it is not the same as the proportion of eligible pets treated or the product’s share of total parasiticide revenue.
Investors should monitor sales growth, clinic-level adoption, repeat demand, international availability and competition from other broad-spectrum parasite-control products.
Innovation revenue: a portfolio rather than a single-product story
Elanco’s US$1.25 billion innovation revenue target makes the performance of its newer products particularly important. Management has linked innovation-led growth with market-share gains, stronger margins and improved leverage.
A diversified portfolio can reduce dependence on a single launch, but multiple launches also require manufacturing capacity, commercial investment, veterinarian education, regulatory support and supply reliability. A product that is well received clinically may still take time to achieve its financial potential if distribution or supply is constrained.
Elanco’s Q3 release should therefore be assessed across both the size of the innovation contribution and its effect on the wider business.
Debt and cash generation remain central
Elanco reported a net leverage ratio of 3.1x adjusted EBITDA at the end of Q2 and targeted approximately 3.0x by year-end. It also said its productivity programme, Elanco Ascend, remained on track to deliver US$200–250 million in net adjusted EBITDA savings by 2030.
For investors, the critical test is whether growth converts into cash and reduces financial leverage without compromising necessary commercial and R&D investment. A strong launch quarter would be more compelling if accompanied by improving margins, working-capital discipline and progress toward the company’s leverage target.
Analyst assessment: Elanco enters Q3 with the clearest published near-term growth momentum among the three companies, but the durability of that momentum remains to be demonstrated. Product adoption, margin expansion, cash conversion and debt reduction need to progress together.
IDEXX Laboratories: recurring diagnostics and installed-base economics
IDEXX has a different business model from the two pharmaceutical companies. Its companion-animal diagnostics business includes instruments, recurring consumables, reference laboratory services, rapid assays, software and other veterinary diagnostic products.
The installed-base model is strategically important because instruments can support recurring demand for consumables and testing services. However, instrument placements alone are not sufficient: the installed instruments must be used, and customers must continue to purchase consumables and diagnostic services.
Q2 financial performance
IDEXX metric |
Q2 2026 |
Year-on-year change |
|---|---|---|
Total revenue |
US$1.217 billion |
+10% reported; +9% organic |
Companion Animal Group revenue |
— |
+9% reported and organic |
CAG Diagnostics recurring revenue |
— |
+11% reported; +10% organic |
IDEXX VetLab consumables |
— |
+15% reported; +14% organic |
Reference laboratory diagnostics and consulting |
— |
+11% reported; +10% organic |
IDEXX inVue Dx placements |
More than 1,600 during Q2 |
Installed base above 9,000 |
Adjusted/comparable operating margin |
35.0% reported operating margin |
+140 basis points reported |
Source: IDEXX Q2 2026 earnings release. Official results.
The figures show that recurring diagnostics are the core strength of IDEXX’s business. Consumables and reference-laboratory services both grew at double-digit rates, while the installed base of premium instruments continued to expand.
IDEXX’s capital-instrument revenue declined 19% reported and 20% organic, partly reflecting the comparison with the prior-year availability of the inVue Dx platform. This illustrates why investors should separate instrument placements from recurring utilisation: capital sales may fluctuate even when the recurring revenue base remains healthy.

Full-year guidance: the updated numbers
IDEXX’s latest full-year guidance is:
Metric |
2026 guidance |
|---|---|
Revenue |
US$4.700–4.745 billion |
Reported revenue growth |
9.1%–10.3% |
Organic revenue growth |
8.5%–9.7% |
CAG Diagnostics recurring revenue growth, reported |
10.1%–11.3% |
CAG Diagnostics recurring revenue growth, organic |
9.5%–10.7% |
Operating margin |
32.3%–32.5% |
Operating margin expansion |
70–90 basis points |
EPS |
US$14.69–14.94 |
Source: IDEXX Q2 2026 results. The guidance range was updated in August; it supersedes the earlier revenue and EPS ranges quoted in the supplied draft.
The outlook is supported by continued recurring-revenue growth and operating-margin expansion. Management also noted a currency-related revenue headwind in its revised projections, illustrating why reported growth and organic growth should be considered separately.
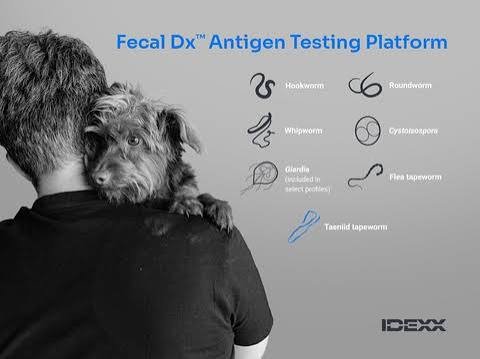
Fecal Dx: increasing the clinical utility of routine testing
IDEXX’s Fecal Dx antigen platform is designed to detect parasite-specific antigens rather than relying solely on the presence of eggs. The company has added taeniid tapeworm detection, including detection of Taenia species and Echinococcus species listed in its product information.
This expands the platform’s diagnostic menu and may support more comprehensive testing within routine veterinary workflows. However, the commercial outcome depends on veterinarian adoption, testing protocols, the relevance of the added tests to patient populations and whether the expanded menu increases total testing utilisation.
The company announced expansion of Fecal Dx antigen testing in the United Kingdom in September 2026. Investors should look for commentary on menu expansion, customer uptake and whether diagnostic innovations are contributing to recurring revenue rather than merely shifting tests between platforms.
Reference: IDEXX Fecal Dx antigen testing.
inVue Dx and the instrument-to-consumables flywheel
The inVue Dx installed base surpassed 9,000 instruments after more than 1,600 placements in Q2. IDEXX also reported continued strength in VetLab consumables and reference-laboratory revenue.
The commercial model is potentially self-reinforcing: a larger installed base can support more consumable use, more testing and deeper customer relationships. Yet the relationship is not automatic. Instrument placement quality, utilisation per instrument, consumable revenue per customer and the pace of customer additions remain important measures.
For Q3, investors should focus on:
-
recurring revenue growth and testing volumes;
-
instrument placements and utilisation;
-
consumables revenue per installed instrument;
-
reference-laboratory volumes and customer retention;
-
operating-margin expansion and investment spending;
-
clinical-visit trends and their effect on diagnostic demand.
Analyst assessment: IDEXX’s Q3 test is execution rather than a turnaround. The company’s recurring revenue base and updated guidance imply that sustained diagnostic utilisation, customer expansion and margin management will matter more than any single capital-instrument metric.
Comparative analysis: three different earnings profiles
Investment dimension |
Zoetis |
Elanco |
IDEXX |
|---|---|---|---|
Business model |
Pharmaceuticals, vaccines and animal-health products |
Pharmaceuticals, vaccines and animal-health products |
Diagnostics, instruments, consumables, reference laboratories and software |
Q2 revenue signal |
Flat reported; −1% organic operational |
+10% reported; +8% organic constant currency |
+10% reported; +9% organic |
Key growth focus |
Established companion-animal franchises and broader portfolio |
Zenrelia, Credelio Quattro and wider innovation portfolio |
Recurring diagnostics, consumables, laboratory services and installed-base expansion |
Current guidance signal |
Material reduction in revenue and adjusted EPS outlook |
Raised revenue, EBITDA, EPS and innovation targets |
Higher/narrowed revenue outlook and higher EPS outlook |
Main Q3 risk |
Continued weakness or uncertainty after guidance reduction |
Launch growth failing to translate into margin and cash flow |
Slower testing utilisation or weaker clinic activity |
Key operating measure |
Organic operational growth and adjusted earnings |
Innovation sales, EBITDA margin, leverage and cash conversion |
Recurring diagnostic revenue, utilisation and operating margin |
Core investor question |
Has performance stabilised? |
Is innovation growth durable and profitable? |
Can recurring diagnostics continue compounding? |

