


Global soybean markets are entering marketing year 2026/27 with competing forces at work: record or near-record US production is providing a supply cushion, but rapidly expanding soybean crushing, stronger demand for soybean oil as a biofuel feedstock, and uncertainty surrounding Brazil’s next crop are increasing the potential for price volatility.
That is the central message in CoBank’s October 7, 2026, market assessment by Tanner Ehmke, Lead Economist. CoBank reports that US soybean crushing and export demand remain strong enough to threaten a significant tightening in domestic ending stocks, even with a large harvest expected. The next major test will come as South American planting progresses and markets reassess the impact of weather, especially the risk of an El Niño-related disruption.
Key numbers shaping the 2026/27 soybean outlook
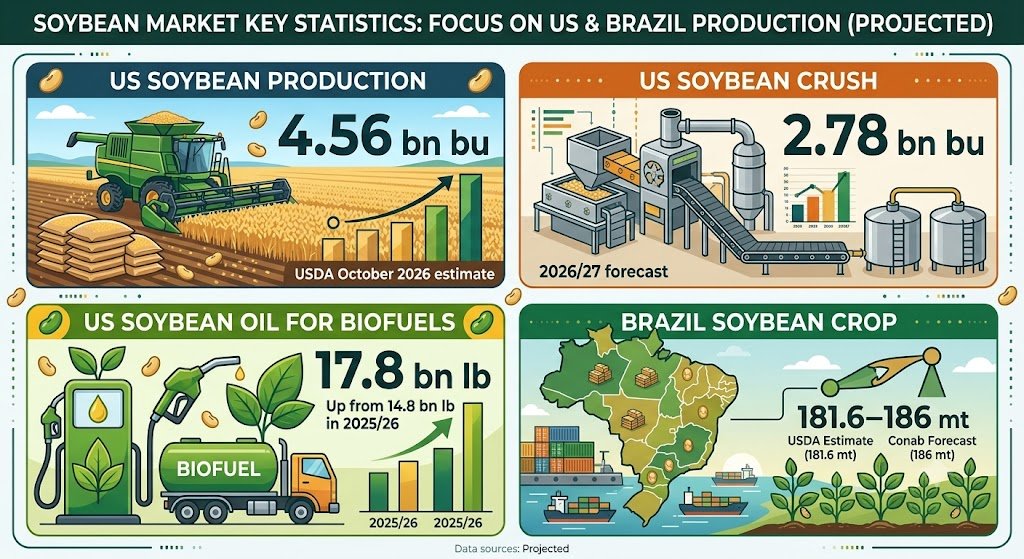
The Brazilian numbers illustrate why forecast differences matter. USDA’s October estimate was 186 million metric tonnes, while Conab’s September outlook put Brazil’s crop at 181.64 million tonnes. These are not contradictory measurements of an already harvested crop; they are forecasts built on different assumptions and issued at different points in the season. The spread of roughly 4.4 million tonnes is commercially meaningful in a market where Brazil is the largest source of export competition for US soybeans.
Why biofuel demand is changing the soybean market
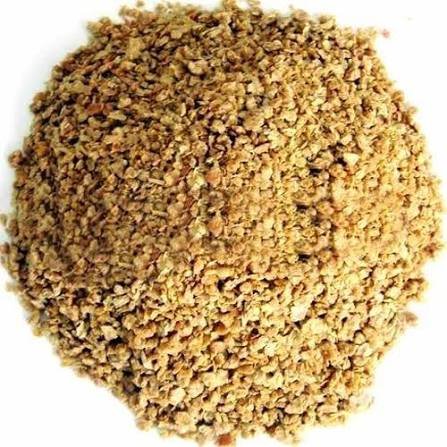
Soybeans have two major commercial outputs. Crushing produces soybean meal, used primarily in animal feed, and soybean oil, used in food, industrial applications and biofuels. That creates a link between the agricultural commodity market and energy-policy decisions.
USDA’s May outlook forecast soybean oil use in biomass-based diesel production at 17.8 billion pounds in MY2026/27, up 3.6 billion pounds from 14.2 billion pounds implied by that comparison—or 3.0 billion pounds above the separate 2025/26 estimate of 14.8 billion pounds in the October market reporting. The latest October estimate maintains 17.8 billion pounds for 2026/27 and 14.8 billion pounds for 2025/26. The year-on-year increase is therefore 3.0 billion pounds, or approximately 20.3%.
That is a significant additional call on soybean oil. It does not mean soybean demand must rise by the same percentage, because processors also respond to meal prices, crush margins, inventories, and the availability of alternative oils and fats. But it makes the economics of crushing more sensitive to biofuel policy.
Indicator |
MY2025/26 estimate |
MY2026/27 forecast |
Market implication |
|---|---|---|---|
US soybean oil use for biofuels |
14.8 bn lb |
17.8 bn lb |
More oil demand from energy markets |
US soybean crush |
— |
2.78 bn bu |
Large domestic processing requirement |
US soybean production |
— |
4.56 bn bu |
Large harvest cushions the balance |
US soybean ending stocks |
— |
315 mn bu |
A cushion, but not unlimited |
Note: USDA’s latest October figures are used where available. The crush figure is the USDA forecast reported by the agency in its market outlook; production and stocks are from the October 2026 WASDE coverage

What is driving the biofuel pull?
Three forces are especially relevant:
-
Federal blending requirements: Renewable volume obligations create demand for biomass-based diesel and associated feedstocks.
-
Tax and state-level incentives: Incentives can influence which feedstocks are economic, how much plants run and where production capacity is located.
-
Energy security and global policy: Higher energy prices and biofuel programmes in other countries can increase competition for vegetable oils and waste-based feedstocks.
CoBank’s October biofuel analysis notes that soybean oil remains a major feedstock for US biomass-based diesel, but the market still depends on policy implementation, the treatment of small-refinery exemptions, imports and competing feedstocks. In other words, a policy announcement can alter soybean-oil price expectations even before the physical volume is consumed.
The critical transmission mechanism: stronger soybean-oil demand can improve crushing economics, encouraging processors to buy more beans. That supports soybean basis and crush activity, while increasing the importance of the relationship between soybean oil and soybean meal prices. It does not guarantee a uniform rise in futures prices; a sufficiently large crop or weaker meal demand can offset some of the pressure.
Brazil: the largest supply-side variable
Brazil is central to the global soybean balance because it combines a very large crop with a major export-oriented supply chain. Its 2026/27 production outcome will influence how much competition US exporters face, how importers allocate purchases between origins, and how much of the global market’s expected demand growth can be met without higher prices.
Forecasts show a large crop—but uncertainty remains
Brazil’s official crop-supply agency, Conab, projected total grain production of 366.6 million tonnes for the 2026/27 season in its September outlook. Within that total, it estimated soybean production at 181.64 million tonnes, with planted area expected to reach 49.3 million hectares, up 1.4% year on year. Conab also warned that expected average productivity could ease from the previous season’s high base and identified climate-related risks.
Brazil 2026/27 indicator |
Conab outlook |
USDA October outlook |
|---|---|---|
Soybean production |
181.64 mt |
186 mt |
Soybean planted area |
49.3 million ha |
Not shown in the cited summary |
Area growth |
+1.4% year on year |
— |
Principal uncertainty |
Yield and climate conditions |
Yield and final crop outcome |
The figures above come from separate agency forecasts, issued on different dates. They are not alternative measurements of final production.
El Niño raises the stakes for weather monitoring
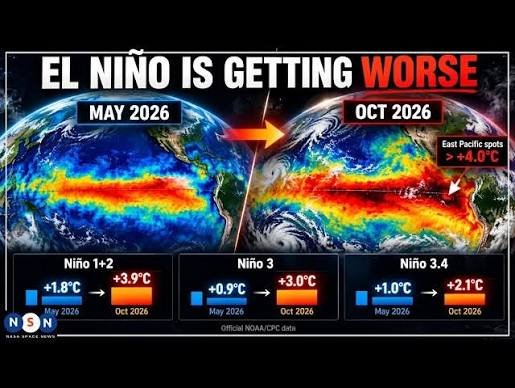
The weather risk deserves close attention. Brazil’s national space research agency, INPE, reported in its September bulletin that NOAA/CPC forecasts gave more than a 90% probability of a very strong El Niño during September–November 2026, with the event likely to persist into early 2027. The bulletin indicated a broad tendency toward above-average rainfall in parts of southern Brazil and below-average rainfall across parts of the country’s central and northern regions during the September–November period.
The World Meteorological Organization also reported on October 8 that the event was expected to persist until February 2027, with a potentially exceptional intensity.
These forecasts should be interpreted carefully. El Niño does not automatically mean a smaller Brazilian soybean crop. Its effects vary by region and season. Rainfall deficits during critical growth stages can reduce yield; excessive rain can complicate planting, harvesting and transport. Weather forecasts identify risk, not a confirmed production loss.
For market participants, the most useful signals will be:
-
Planting progress compared with the seasonal calendar.
-
Soil moisture and rainfall in key producing states.
-
Crop-condition reports during flowering and pod filling.
-
Yield revisions as field evidence becomes available.
-
Harvest timing and the speed at which beans reach export terminals.
The market can react well before a crop loss is confirmed. If weather forecasts deteriorate while importers are actively buying and crushers are running hard, risk premiums can build quickly. Conversely, timely rainfall and improving crop conditions can reverse those premiums.
United States: record production does not eliminate tightness
The US soybean balance illustrates the difference between total supply and available supply. USDA’s October estimate put production at 4.56 billion bushels and ending stocks at 315 million bushels for MY2026/27. The agency’s crush forecast was 2.78 billion bushels, while export projections were also adjusted upward in the October reporting.
A large crop is supportive of availability, but three factors can absorb the cushion:
-
Crushing capacity: New and expanded processing plants create demand that is relatively less dependent on overseas buyers of whole soybeans.
-
Exports: Strong foreign demand can draw down inventories even when domestic production is large.
-
Harvest and logistics: A crop is not immediately available everywhere. Wet fields, transport bottlenecks, storage constraints and regional shortages can cause local cash prices to rise despite a large national forecast.
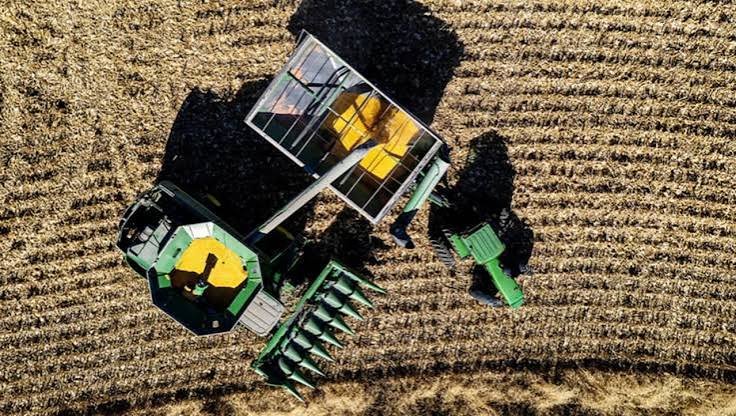
The third point was visible in late September. Reuters reported that persistent Midwest rains delayed harvesting, leaving some processors scrambling for immediate supplies and offering unusually high cash premiums. Some plants reduced operations as old-crop supplies dwindled and new-crop deliveries were delayed. The report cited USDA’s then-current 2.78-billion-bushel crush forecast.
China and global trade flows
China remains a crucial driver because of its large soybean import requirement and extensive crushing industry. S&P Global’s August 2026 analysis described China as absorbing about 60% of internationally traded soybeans and reported that Chinese crushing averaged 2.47 million tonnes per week in July, approximately 21% above its five-year average. The same analysis cited a USDA July forecast of 115 million tonnes for China’s 2026/27 soybean imports. These are earlier estimates, not a substitute for the latest monthly trade balance.
China’s demand matters in two ways:
-
Protein and feed demand: Soybean meal supports poultry, swine, aquaculture and other livestock sectors. Changes in feed demand, animal inventories and crushing margins can alter import appetite.
-
Origin selection: Chinese buyers can switch between Brazil, the United States and other origins depending on prices, freight, tariffs, trade policy and shipment timing.
CoBank’s October report said US export commitments had risen to more than double the previous year’s pace, with China returning as a steady buyer following an announced commitment to purchase 25 million tonnes annually through 2028. CoBank also noted that a 10% retaliatory tariff on US soybeans remained a constraint on private Chinese crusher buying. Such commitments and policy conditions are important, but traders must distinguish political announcements from completed purchases and physical shipments.
Why origin switching can amplify volatility
When Brazilian supplies are abundant and competitively priced, importers may favour South American shipments. If Brazilian planting or yields disappoint, buyers may turn to the United States. This can support US export premiums and futures, particularly if domestic crushers are simultaneously competing for the same beans.
The reverse is also possible. A bumper Brazilian crop arriving into export channels can cap rallies in US prices, especially if Chinese demand softens or shipping economics favour Brazil. Global soybean prices are therefore increasingly shaped by the interaction of three variables: the size of Brazil’s crop, US crush demand and the pace of Chinese imports.
What this means for soybean meal, livestock feed and animal protein
Soybeans are not just an oilseed commodity. Their meal is a foundational protein ingredient in commercial animal feed, so volatility in the soybean market can flow into poultry, swine, dairy, beef and aquaculture economics.
The soybean crush is a joint-product market
A processor cannot ordinarily decide to produce soybean oil without also producing soybean meal. Both outputs influence the crush margin:
-
Strong soybean-oil prices can improve the return from crushing.
-
Strong soybean-meal demand can also support crush economics.
-
Weak meal prices can offset some of the benefit from higher oil prices.
-
Higher soybean prices raise input costs for processors and can pressure meal buyers unless product prices adjust.
This joint-product relationship matters to animal-health and feed businesses. A surge in biofuel demand could increase soybean-oil value and encourage processing, potentially increasing meal availability. But if bean costs rise faster than meal values—or if exportable meal supplies are constrained—the feed sector can still face higher costs. The final effect depends on relative prices, processing capacity and regional logistics.
Implications by sector
Sector |
Main exposure |
What to monitor |
|---|---|---|
Poultry |
Soybean meal is a major source of feed protein |
Meal prices, feed-conversion economics, maize prices and local feed inventories |
Swine |
Feed is a major variable production cost |
Soymeal inclusion rates, hog margins, imports and currency movements |
Dairy |
Protein meals support ration formulation and milk production |
Soymeal versus alternative protein prices, forage quality and milk margins |
Beef |
Exposure varies with intensive finishing and supplementation |
Feedlot ration costs and competing protein ingredients |
Aquaculture |
Depends on species, formulation and alternative proteins |
Soy protein prices, fishmeal substitution and feed performance |
These are transmission channels, not forecasts of a guaranteed increase in feed prices. A strong soybean market can coexist with stable or falling meal prices if meal supply expands, livestock demand weakens or alternative feed ingredients become more competitive.
For India and other import-dependent markets, the landed cost also reflects freight, currency exchange rates, duties and domestic supply conditions. A global price rise will not translate one-for-one into local feed costs.
Global supply outlook: the world is not short of soybeans yet
The most important qualification to the volatility thesis is that the global market is not necessarily facing an outright shortage. USDA’s May 2026 outlook projected global soybean crushing at 383.1 million tonnes in MY2026/27, up 13.6 million tonnes from MY2025/26, while global ending stocks were forecast to decline only marginally. These are earlier baseline projections; subsequent USDA updates should be consulted before treating them as the latest world balance.
The May outlook also projected:
-
South American soybean production of 254.3 million tonnes, up 3%.
-
Brazilian production of 186 million tonnes.
-
Brazilian exports of 117.5 million tonnes, equivalent to about 62% of projected global soybean trade.
-
Brazilian soybean crushing of 65 million tonnes, up 6%.
-
Argentine production of 50 million tonnes.
These projections illustrate the scale of South American supply and processing. They also show why Brazil’s weather and Argentina’s export policy can influence prices even when US production is large.
Balance-sheet issue: demand growth versus stock accumulation
In simplified terms:
Ending stocks=Beginning stocks+Production+Imports−Domestic use−Exports = Ending stocks
For market participants, the key is not production alone but the relationship between total supply and total use. A record harvest can still result in falling stocks if crushing and exports grow faster than supply. Conversely, an exceptionally large Brazilian crop, weak Chinese buying or reduced biofuel profitability could leave more beans in storage and put downward pressure on prices.
The USDA’s October outlook and subsequent monthly revisions should therefore be assessed together with actual export sales, crush volumes and crop-weather developments.
India: implications for edible oil, feed costs and trade
India is exposed to global soybean developments through several distinct channels. These should not be conflated: soybean grain, soybean meal and soybean oil have different import-export dynamics.
A. Soybean meal and animal-feed economics
USDA’s India oilseeds outlook projected MY2026/27 soybean production of 11.5 million tonnes and crushing of 10 million tonnes. It also forecast soybean-meal consumption to fall 7% as poultry and livestock producers shifted toward more cost-effective alternatives amid high soybean-meal prices and changing feed preferences. These projections were published earlier in 2026 and should be treated as a baseline rather than a confirmed final outcome.
For Indian feed businesses, the practical priorities are:
-
Monitor domestic soybean arrivals and crushing margins alongside international soybean-meal prices.
-
Compare soybean meal with rapeseed meal, peanut meal and other protein sources on nutritional value, availability and delivered cost.
-
Track poultry and swine demand, since changes in animal production influence protein-meal consumption.
-
Avoid assuming that a higher global soybean price will always translate directly into a higher Indian meal price; domestic crop arrivals, export parity, inventories and alternative feed ingredients can change the outcome.
B. Soybean oil and edible-oil inflation
India is particularly sensitive to the global vegetable-oil market. Reuters reported in September 2026 that India meets roughly two-thirds of its vegetable-oil demand through imports, principally palm, soybean and sunflower oils. The report said vegetable-oil prices had risen nearly 20% over the preceding year and that the government was considering an import-duty reduction to manage consumer costs. That was a reported consideration, not confirmation that a new duty reduction had been implemented.
C. Import sourcing and origin risk
India’s trade flows have also highlighted the importance of customs compliance. Reuters reported on October 5 that Indian authorities were investigating soybean shipments declared as originating in Niger, amid concerns that some cargoes might actually originate in Nigeria and have been mislabelled to qualify for preferential treatment. The report said soybean imports declared from Niger had reached 380,868 tonnes during the first seven months of 2026, despite Niger’s negligible production. The investigation and its outcome should be distinguished from any final determination of wrongdoing.
For importers, this is a reminder that the economics of a low-cost cargo cannot be assessed on price alone. Certificates of origin, transit records, phytosanitary documentation and tariff eligibility are essential parts of landed-cost risk management.
3 scenarios for the remainder of MY2026/27
The following is a qualitative scenario framework, not a price target or a prediction of a specific futures level.
Trigger: Brazilian rainfall or crop development disappoints while US crushing and export demand remain firm.
Reduced South American production expectations would make exporters compete for available supply. Buyers could shift more demand to the United States, while biofuel-related crushing sustains domestic demand. Prices and local basis could rise together, although the extent would depend on inventories and demand response.
Trigger: Brazil achieves a large crop and US crush demand remains strong.
Ample South American supply offsets part of the additional demand from biofuels and exports. Prices may remain volatile as markets respond to weather and monthly balance-sheet revisions, without a sustained supply-driven rally.
Trigger: Brazil delivers a strong crop, Chinese import demand weakens, or biofuel economics deteriorate.
Export competition could intensify, US ending stocks could rise relative to expectations, and soybean futures could come under pressure. Soybean oil might also weaken if mandates, incentives or plant economics fail to deliver expected demand growth.
What would confirm each scenario?
Indicator to track |
Bullish signal |
Bearish signal |
|---|---|---|
Brazil crop |
Deteriorating rainfall or downward yield revisions |
Timely rainfall and upward crop revisions |
US crush |
Strong actual crush and firm processor margins |
Lower crush or weaker margins |
US exports |
Sales and shipments exceed expectations |
Sales lag USDA projections |
China |
Stronger import buying and improving crush economics |
High inventories, weak feed demand and reduced purchases |
Soybean-oil biofuel demand |
Policy support translates into higher actual consumption |
Regulatory delays or weaker economics |
Global ending stocks |
Revisions lower |
Revisions higher |
One particular risk is a divergence between policy expectations and realised demand. A high biofuel mandate does not automatically translate into an equivalent increase in soybean-oil consumption if plants use alternative feedstocks, operating economics deteriorate or policy implementation changes.

Indicators agribusiness executives should monitor
For grain traders, crushers, feed manufacturers, poultry integrators and agricultural investors, the following dashboard would help separate market headlines from actual changes in fundamentals.
Monthly USDA WASDE and Oilseeds: World Markets and Trade
Track revisions to production, crush, exports, imports and ending stocks. The October 9 WASDE is the latest available release as of October 12, 2026
Follow Conab crop reports, INPE/NOAA climate updates, planting progress and yield estimates. Watch regional rainfall rather than relying on the El Niño label alone.
Actual crushing, soybean-oil use, imports of competing feedstocks and processor margins help test whether forecast demand is materialising.
Compare US export commitments and shipments with USDA targets, and track Brazilian export availability, shipping economics and changes in trade policy.

